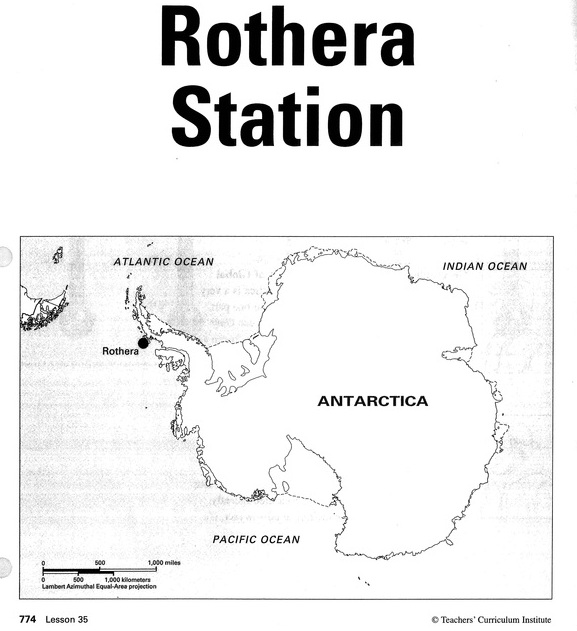
How to Conduct Research at Rothera Station
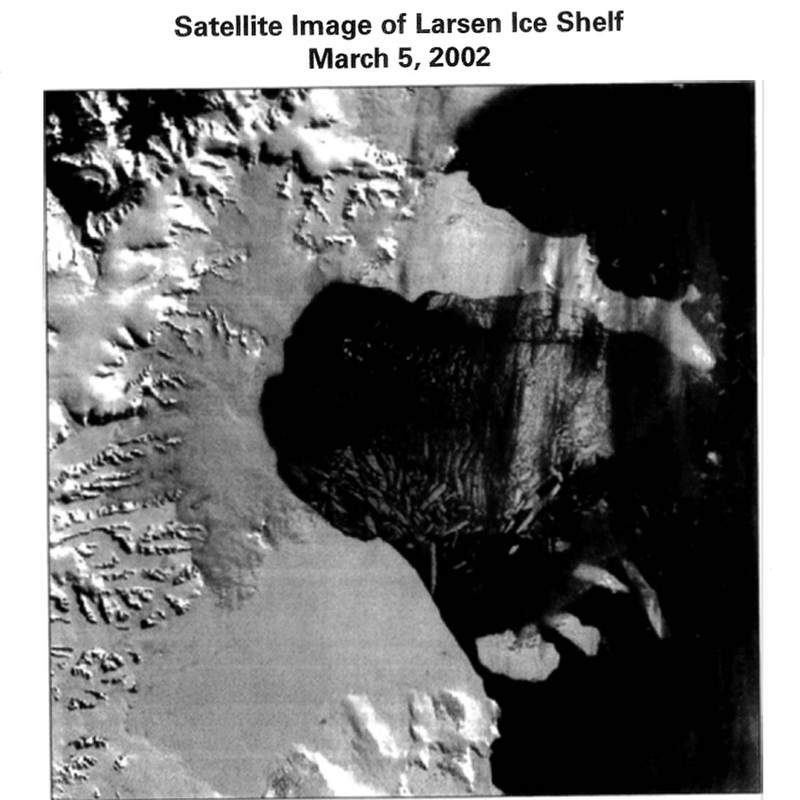
Welcome to Rothera Station. At this research station, you will examine two satellite images taken during the breakup of the Larsen Ice Shelf in
2002. You will use this information to calculate the area and percentage of ice shelf lost. You will also listen to geographers as they debate what
this information tells us about global warming.
Studying Ice Shelves in Antarctica
Ice shelves are floating sheets of ice that are still attached to the continent. Ice shelves form half of Antarctica's coastline and more than a tenth of its surface area. Every summer, the edges of Antarctic ice shelves break off to form icebergs. An iceberg is a large mass of ice floating around in the ocean. Researchers in Antarctica study ice shelves to see if they are growing or melting. They also watch for large chunks of ice that break off and float away. One way they do this is by placing cameras on satellites that orbit, or circle, Earth. The cameras take pictures of ice shelves as they form and break apart. Researchers also spend time at observation posts on or near ice shelves. From these posts they can study how seasonal temperature changes affect the ice shelves.
Follow these steps:
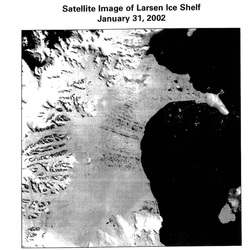
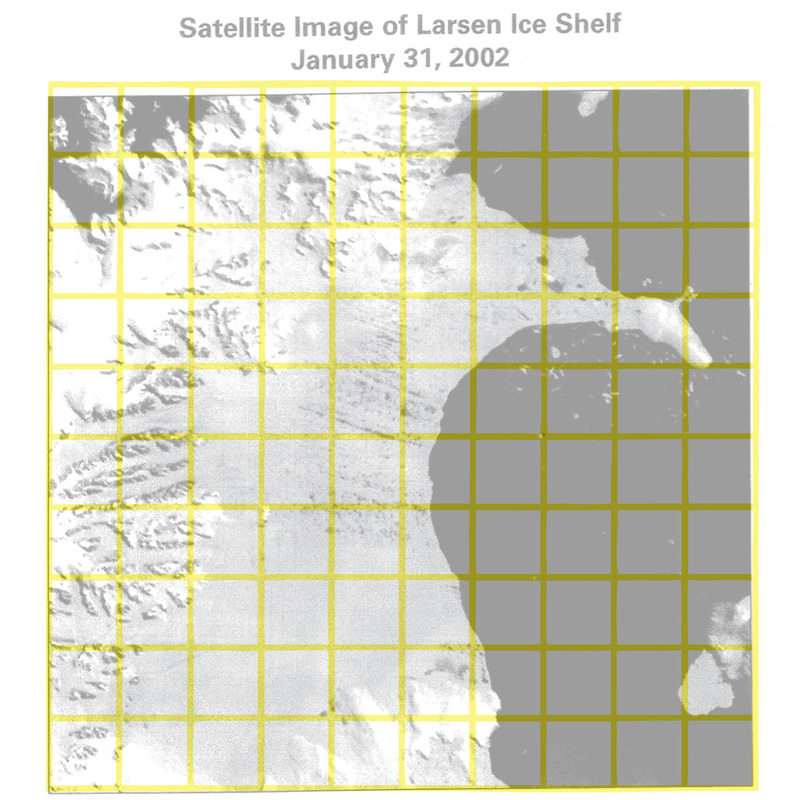
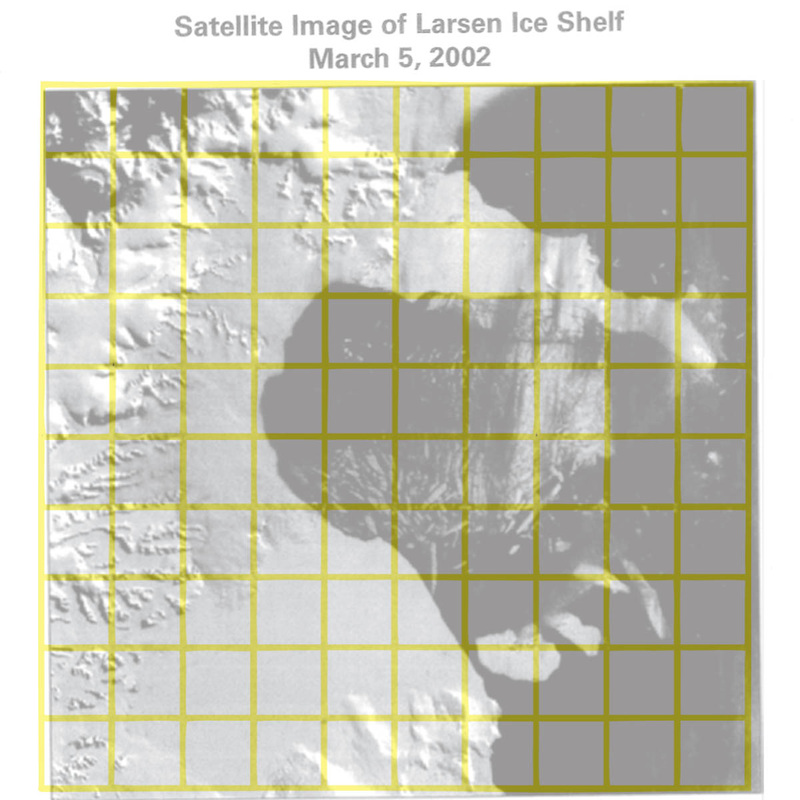
1. On the images below, the Larsen Ice Shelf is white and the ocean is black. Below each picture is an identical picture with a counting grid overlayed on top of it
2. Calculate how much ice was lost from the Larsen Ice Shelf.
• Color the area between the two lines you traced.
• Count the number of squares fully containing ice shelf. Then count the number of
squares containing some ice shelf and some ocean water. Enter these numbers in your Reading Notes.
• Calculate the total area of ice lost from the Larsen Ice Shelf during
this time period. Then calculate the percentage of ice lost.
3. Analyze the ice shelf data. With your partner, discuss whether you think the information supports the theory of global warming, casts
doubt on the theory, or could be evidence for both sides of the debate.
Write your conclusion and explanation in the comments section of the "Rothera Station" blog in this website. (be sure to include your names with your comments)
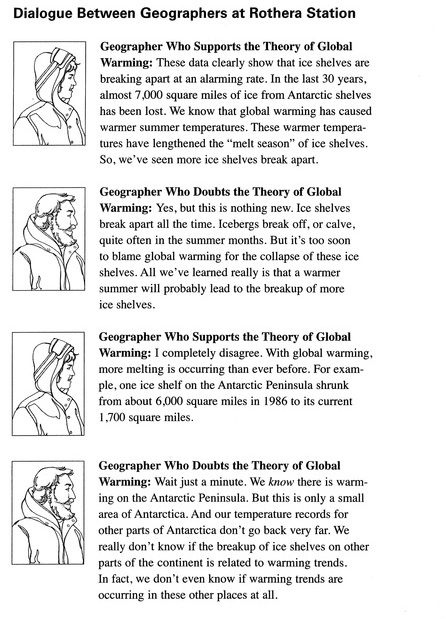
4. Read the Dialogue Between Geographers at Rothera Station (bottom of this page) aloud.
One of you should read the part of geographer who supports the theory of global warming. The other should read the part of the geographer
who doubts it.
5. Based on the dialogue, write arguments in the comments section of the "Rothera Station" blog that a supporter and a doubter of the global warming theory might make. (be sure to include your names with your comments)
2002. You will use this information to calculate the area and percentage of ice shelf lost. You will also listen to geographers as they debate what
this information tells us about global warming.
Studying Ice Shelves in Antarctica
Ice shelves are floating sheets of ice that are still attached to the continent. Ice shelves form half of Antarctica's coastline and more than a tenth of its surface area. Every summer, the edges of Antarctic ice shelves break off to form icebergs. An iceberg is a large mass of ice floating around in the ocean. Researchers in Antarctica study ice shelves to see if they are growing or melting. They also watch for large chunks of ice that break off and float away. One way they do this is by placing cameras on satellites that orbit, or circle, Earth. The cameras take pictures of ice shelves as they form and break apart. Researchers also spend time at observation posts on or near ice shelves. From these posts they can study how seasonal temperature changes affect the ice shelves.
Follow these steps:
1. On the images below, the Larsen Ice Shelf is white and the ocean is black. Below each picture is an identical picture with a counting grid overlayed on top of it
2. Calculate how much ice was lost from the Larsen Ice Shelf.
• Color the area between the two lines you traced.
• Count the number of squares fully containing ice shelf. Then count the number of
squares containing some ice shelf and some ocean water. Enter these numbers in your Reading Notes.
• Calculate the total area of ice lost from the Larsen Ice Shelf during
this time period. Then calculate the percentage of ice lost.
3. Analyze the ice shelf data. With your partner, discuss whether you think the information supports the theory of global warming, casts
doubt on the theory, or could be evidence for both sides of the debate.
Write your conclusion and explanation in the comments section of the "Rothera Station" blog in this website. (be sure to include your names with your comments)
4. Read the Dialogue Between Geographers at Rothera Station (bottom of this page) aloud.
One of you should read the part of geographer who supports the theory of global warming. The other should read the part of the geographer
who doubts it.
5. Based on the dialogue, write arguments in the comments section of the "Rothera Station" blog that a supporter and a doubter of the global warming theory might make. (be sure to include your names with your comments)
|
|