How to Conduct Research at Palmer Station
Studying Penguins in Antarctica
The Adelie is the most common penguin in this polar biome. Nearly 5 million Adelies call Antarctica home. Each summer they raise their young on the few areas of coastline that are not covered with ice. Global warming could be bad for Adelies. Warmer air can hold more moisture. This could lead to increased snowfall in Antarctica.
If snow covers the few bare spots that the penguins need for nesting, they might stop breeding. Researchers are studying how many Adelie penguins return to their nesting grounds each year. They do this by taking a simple census. This means counting the number of penguins at each nesting site. Researchers also try to track the birds' movements over the year. They glue transmitters on the penguins' feathers and use satellites to track the signals given off. Penguin nests can be counted on the ground, from planes and helicopters using telescoping cameras, and now from satellites. http://online.wsj.com/article/SB10001424052702304180804575188492367512632.html
Counting penguins
An Adélie penguin colony
Every year in late November/early December, scientists from Landcare Research’s penguin team brave the wilds of Antarctica to carry out a census (population count) of the Adélie penguins ( Pygoscelis adeliae) in the Ross Sea region.
The penguins, named by French explorer Jules Dumont d'Urville after his wife Adélie in 1840, are common along the Antarctic coastline and on nearby islands. In the Ross Sea region, there are some 5 million penguins in 38 colonies (just over 38% of the total population). The census is carried out at this time of year as it is when the penguins are incubating their eggs. During incubation, one bird is sitting on the egg while its mate is at sea feeding. Only birds that are incubating eggs tend to be ashore, so counting these birds gives an accurate number of the number of breeding pairs.
Adélie penguins
The scientists count the birds as a means of monitoring environmental change in the Antarctic Ocean ecosystem, both natural and human-induced. For example, a trend over several years showing a decline in the population may indicate the effects of long-term climate change (these birds like to live in the cold), impacts from commercial fishing and/or changes in the krill population (little shrimp-like sea animals that the penguins feed on).
The scientists use aerial reconnaissance and photography to find the breeding locations of Adélie penguins and to count the numbers of nests occupied during the early incubation period. From 1981 to the present, all islands and sea coasts between 158°E and 175°E have been searched, and 11 previously unreported breeding colonies have been discovered.
To take the photos, brave scientists such as Kerry Barton and Philip Lyver from Landcare Research shoot the pictures from helicopters (flying high so as not to disturb the birds) and the open paratroop door of a C130 Hercules plane.
It is not possible to photograph all colonies in the whole Ross Sea region every year, so the scientists photograph the Ross Island colonies every year, and every 2 to 3 years, they photograph some of the colonies along the Victoria Land coast. These colonies are specially selected because of their size, topography and locality.
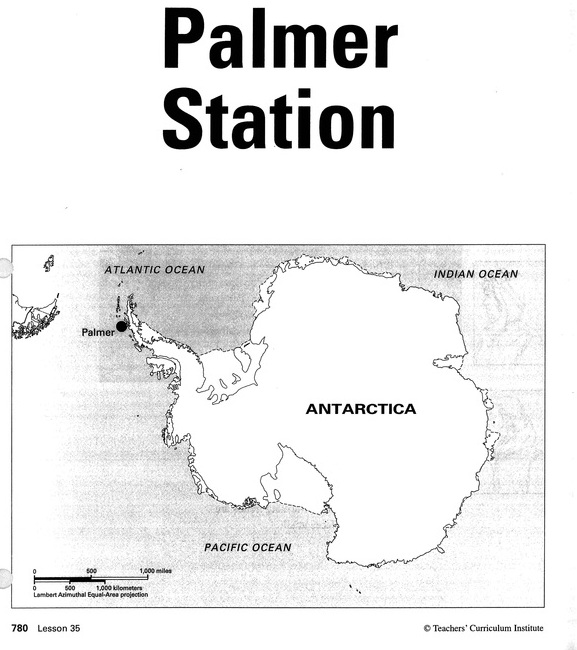
How to Conduct Research at Palmer Station
Welcome to Palmer Station. At this research station, you will complete a census, or population count, of Adelie penguins in the area. You will then
calculate the percentage increase or decrease in the local Adelie penguin population. You will also listen to geographers as they debate what this
information tells us about global warming.
Follow these steps:
1. With your partner, analyse the Emperor penguin 2009 colony data map. Record your answers and explanation to questions 1a & 1b in the comments section of the "Palmer Station" blog in this website. (be sure to include your names with your comments)
a) What does the size of of the red dots on the map mean?
b) Does the distribution of Emperor penguin colonies in 2009 tell us anything about global warming?
2. Read and explore this website: http://www.penguinscience.com/education/royds_nestcheck.php
3. Analyze the Adelie and Emperor penguin census data from 1970 to 2000. With your partner, discuss whether you think the information supports the theory of global warming, casts doubt on the theory, or could be evidence for both sides of the debate. Does this data come from penguin populations at Palmer Station itself? How do you know? Why or why not? Record your conclusion and explanation in the comments section of the "Palmer Station" blog in this website. (be sure to include your names with your comments)
4. Read the Dialogue Between Geographers at Palmer Station aloud. One of you should read the part of the geographer who supports the theory
of global warming. The other should read the part of the geographer who doubts it.
5. Based on the dialogue, write arguments in the comments section of the "Palmer Station" blog that a supporter and a doubter of the global warming theory might make. (be sure to include your names with your comments)
The Adelie is the most common penguin in this polar biome. Nearly 5 million Adelies call Antarctica home. Each summer they raise their young on the few areas of coastline that are not covered with ice. Global warming could be bad for Adelies. Warmer air can hold more moisture. This could lead to increased snowfall in Antarctica.
If snow covers the few bare spots that the penguins need for nesting, they might stop breeding. Researchers are studying how many Adelie penguins return to their nesting grounds each year. They do this by taking a simple census. This means counting the number of penguins at each nesting site. Researchers also try to track the birds' movements over the year. They glue transmitters on the penguins' feathers and use satellites to track the signals given off. Penguin nests can be counted on the ground, from planes and helicopters using telescoping cameras, and now from satellites. http://online.wsj.com/article/SB10001424052702304180804575188492367512632.html
Counting penguins
An Adélie penguin colony
Every year in late November/early December, scientists from Landcare Research’s penguin team brave the wilds of Antarctica to carry out a census (population count) of the Adélie penguins ( Pygoscelis adeliae) in the Ross Sea region.
The penguins, named by French explorer Jules Dumont d'Urville after his wife Adélie in 1840, are common along the Antarctic coastline and on nearby islands. In the Ross Sea region, there are some 5 million penguins in 38 colonies (just over 38% of the total population). The census is carried out at this time of year as it is when the penguins are incubating their eggs. During incubation, one bird is sitting on the egg while its mate is at sea feeding. Only birds that are incubating eggs tend to be ashore, so counting these birds gives an accurate number of the number of breeding pairs.
Adélie penguins
The scientists count the birds as a means of monitoring environmental change in the Antarctic Ocean ecosystem, both natural and human-induced. For example, a trend over several years showing a decline in the population may indicate the effects of long-term climate change (these birds like to live in the cold), impacts from commercial fishing and/or changes in the krill population (little shrimp-like sea animals that the penguins feed on).
The scientists use aerial reconnaissance and photography to find the breeding locations of Adélie penguins and to count the numbers of nests occupied during the early incubation period. From 1981 to the present, all islands and sea coasts between 158°E and 175°E have been searched, and 11 previously unreported breeding colonies have been discovered.
To take the photos, brave scientists such as Kerry Barton and Philip Lyver from Landcare Research shoot the pictures from helicopters (flying high so as not to disturb the birds) and the open paratroop door of a C130 Hercules plane.
It is not possible to photograph all colonies in the whole Ross Sea region every year, so the scientists photograph the Ross Island colonies every year, and every 2 to 3 years, they photograph some of the colonies along the Victoria Land coast. These colonies are specially selected because of their size, topography and locality.
How to Conduct Research at Palmer Station
Welcome to Palmer Station. At this research station, you will complete a census, or population count, of Adelie penguins in the area. You will then
calculate the percentage increase or decrease in the local Adelie penguin population. You will also listen to geographers as they debate what this
information tells us about global warming.
Follow these steps:
1. With your partner, analyse the Emperor penguin 2009 colony data map. Record your answers and explanation to questions 1a & 1b in the comments section of the "Palmer Station" blog in this website. (be sure to include your names with your comments)
a) What does the size of of the red dots on the map mean?
b) Does the distribution of Emperor penguin colonies in 2009 tell us anything about global warming?
2. Read and explore this website: http://www.penguinscience.com/education/royds_nestcheck.php
3. Analyze the Adelie and Emperor penguin census data from 1970 to 2000. With your partner, discuss whether you think the information supports the theory of global warming, casts doubt on the theory, or could be evidence for both sides of the debate. Does this data come from penguin populations at Palmer Station itself? How do you know? Why or why not? Record your conclusion and explanation in the comments section of the "Palmer Station" blog in this website. (be sure to include your names with your comments)
4. Read the Dialogue Between Geographers at Palmer Station aloud. One of you should read the part of the geographer who supports the theory
of global warming. The other should read the part of the geographer who doubts it.
5. Based on the dialogue, write arguments in the comments section of the "Palmer Station" blog that a supporter and a doubter of the global warming theory might make. (be sure to include your names with your comments)
Emperor penguin colonies 2009 - Size and Geographical distribution.
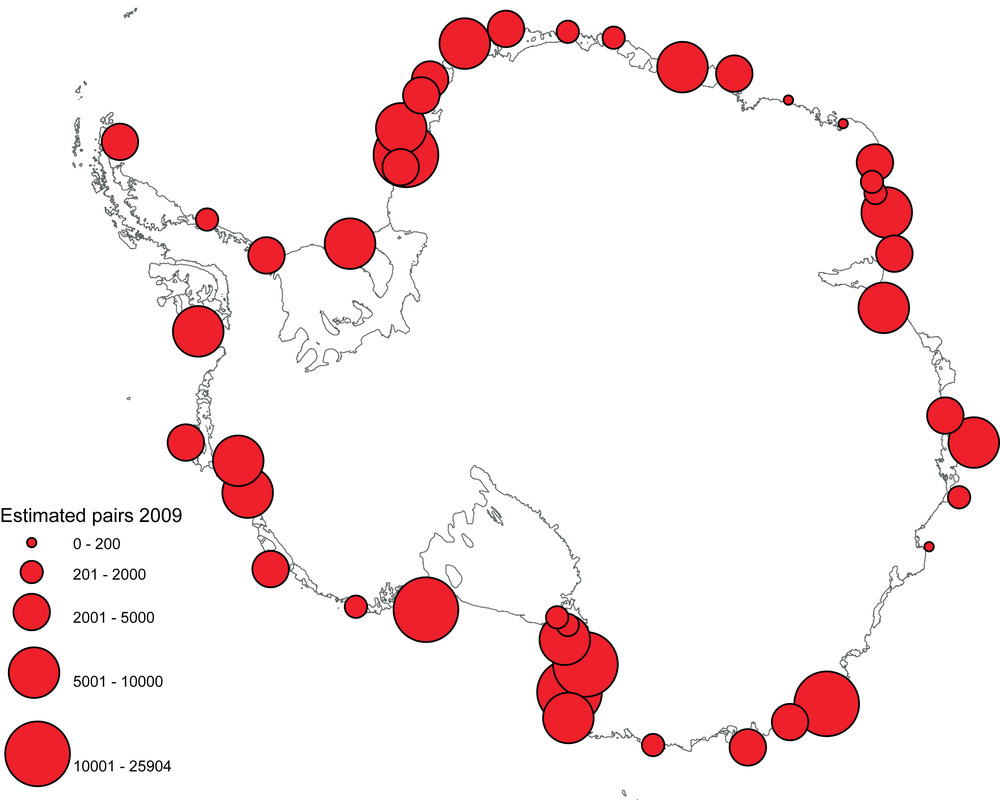
Peter T. Fretwell, Michelle A. LaRue, Paul Morin, Gerald L. Kooyman, Barbara Wienecke, Norman Ratcliffe, Adrian J. Fox, Andrew H. Fleming, Claire Porter, Phil N. Trathan. An Emperor Penguin Population Estimate: The First Global, Synoptic Survey of a Species from Space.PLoS ONE, 2012; 7 (4): e33751 DOI:
Population changes of Adelie and emperor penguins from 1970-2000
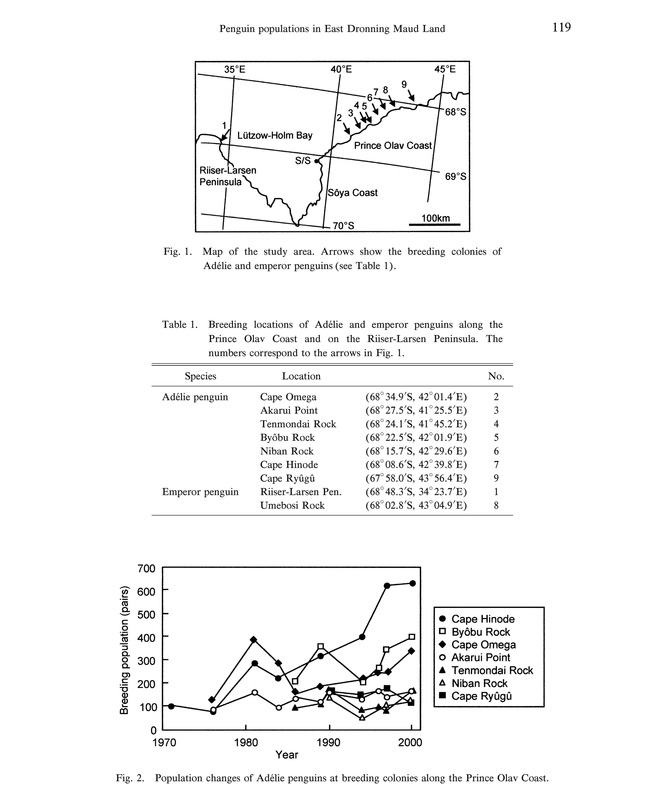
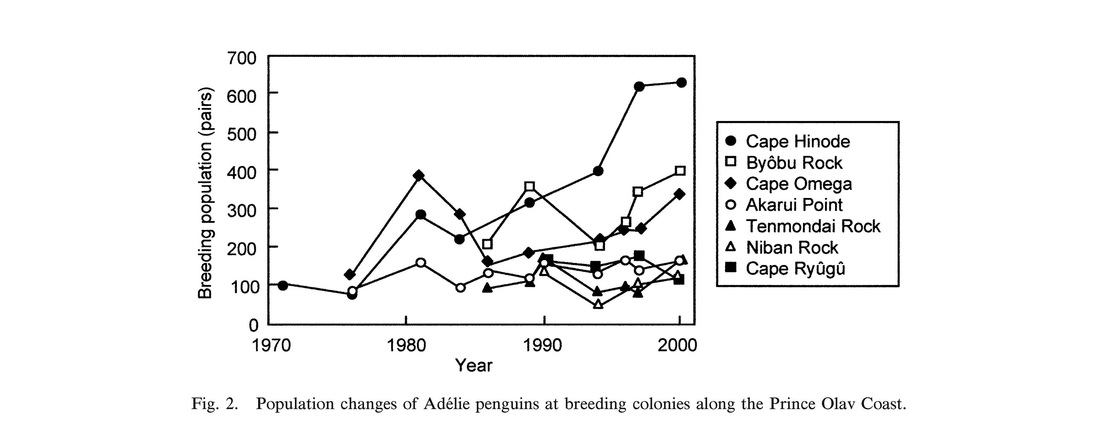
Kato A, Watanabe K, Naito Y (2004) Population changes of Adelie and emperor penguins along the Prince Olav Coast and on the Riiser-Larsen Peninsula. Polar Bioscience 17; 117–122: